
第 9 章 子图与布局
学习目标
- 掌握
plt.subplots(nrows, ncols)的多子图布局 - 用
sharex/sharey共享坐标轴 - 用循环批量绘制子图
- 用
tight_layout处理元素重叠 - 用
GridSpec画不规则布局
9.1 共享坐标轴:sharex / sharey
第 2 章会画 subplots(2, 2) 网格了。多子图对比同一段横轴时,sharex=True 让所有子图共享 x 轴范围,只在最下面一个子图显示 x 刻度,画面干净得多:
import matplotlib.pyplot as plt
import numpy as np

rng = np.random.default_rng(9)
day30 = np.arange(1, 31)
temp  = 26 + 6 * np.sin(day30 / 30 * 2 * np.pi) + rng.normal(0, 1.5, 30)
humid = 65 + 10 * np.cos(day30 / 30 * 2 * np.pi) + rng.normal(0, 3, 30)
wind  = 12 + 4 * np.sin(day30 / 30 * 4 * np.pi) + rng.normal(0, 2, 30)
rain  = np.clip(rng.gamma(1.5, 2, 30), 0, None)

fig, axes = plt.subplots(4, 1, figsize=(7, 8), sharex=True)
axes[0].plot(day30, temp, color="#d33f49");  axes[0].set_ylabel("气温(°C)")
axes[1].plot(day30, humid, color="#11557c"); axes[1].set_ylabel("湿度(%)")
axes[2].plot(day30, wind, color="#40c0a6");  axes[2].set_ylabel("风速(km/h)")
axes[3].bar(day30, rain, color="#ee8c18");   axes[3].set_ylabel("降雨量(mm)")
axes[3].set_xlabel("日期")
plt.show()
图 9-1 真实输出:四个子图共用同一个 x 范围,四个指标对照着看天气变化:
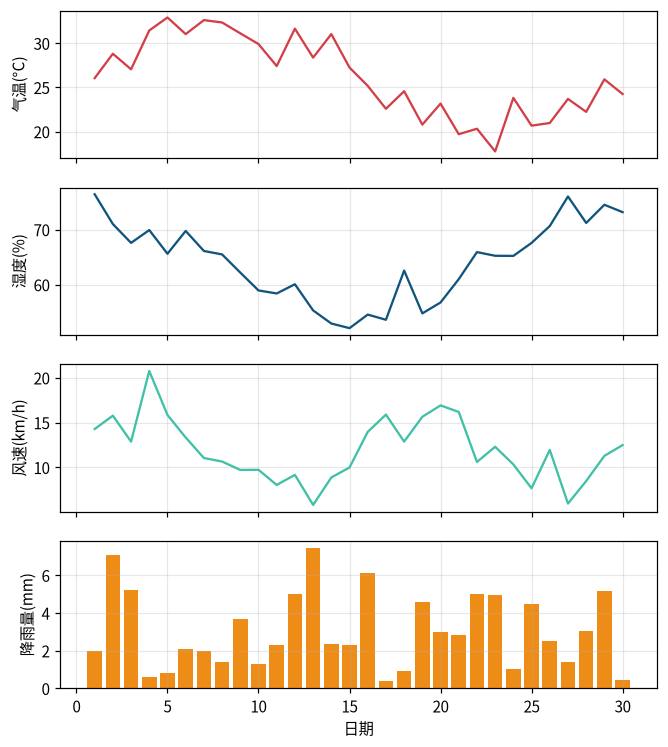
sharey=True 同理共享 y 范围;sharex="col"/sharey="row" 可以按列/按行共享。
9.2 循环批量绘图
子图一多,逐个子图手写很啰嗦。把数据装进列表,用 for 循环配合 axes.flat 批量绘制:
series = [
    (temp, "气温", "#d33f49"), (humid, "湿度", "#11557c"),
    (wind, "风速", "#40c0a6"), (rain, "降雨", "#ee8c18"),
]

fig, axes = plt.subplots(2, 2, figsize=(8, 6))
for ax, (data, name, color) in zip(axes.flat, series):
    ax.plot(day30, data, color=color)
    ax.set_title(name)
    ax.grid(True, alpha=0.3)
fig.suptitle("30 天天气指标(循环批量绘图)", fontsize=13)
plt.show()
图 9-2 真实输出:fig.suptitle 给整张图加一个「总标题」(区别于每个子图的 set_title):
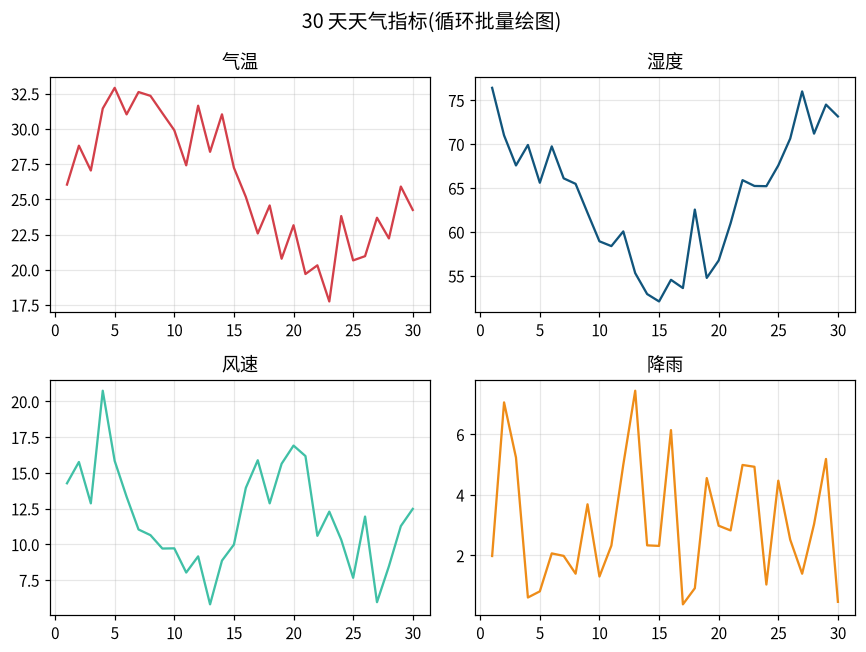
zip(axes.flat, series) 把每个坐标系与对应数据一一配对;数据量再多,代码也只有这么几行。
9.3 tight_layout:修复重叠
子图多了,标题、标签、总标题很容易互相挤压。fig.tight_layout() 自动调整子图间距,让所有元素互不重叠。图 9-3 是没调用时的效果(总标题与顶部子图标题挤在一起):
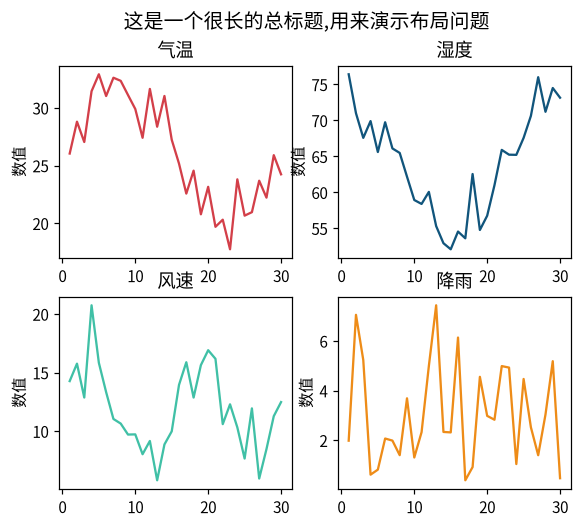
图 9-4 是同一张图加一行 fig.tight_layout() 之后:
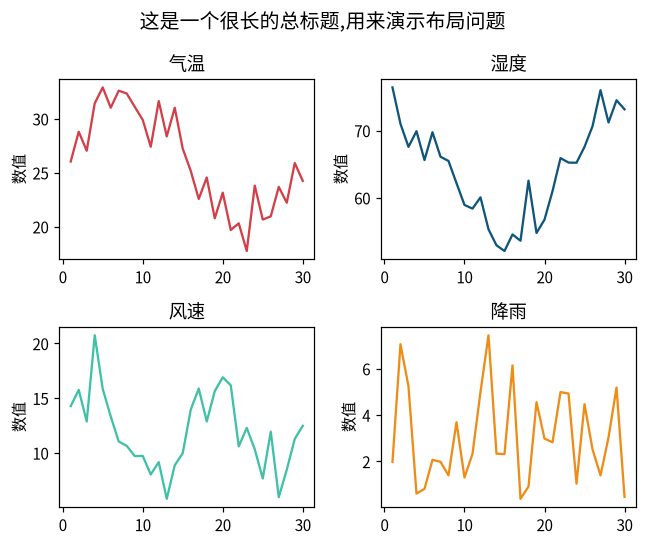
等价的做法是在 plt.subplots(..., layout="constrained") 里启用 constrained layout(推荐用于复杂图),或 layout="tight"。三种选一种即可,不用叠加。
9.4 GridSpec:不规则布局
规则的 m×n 网格用 subplots;需要「某个子图跨多行/多列」的不规则布局,用 GridSpec:
import matplotlib.pyplot as plt
import numpy as np

fig = plt.figure(figsize=(8, 5.5))
gs = fig.add_gridspec(2, 2, height_ratios=[1, 1], width_ratios=[1.6, 1])

ax_big = fig.add_subplot(gs[:, 0])   # 占满左列两行
ax_tl  = fig.add_subplot(gs[0, 1])   # 右上
ax_bl  = fig.add_subplot(gs[1, 1])   # 右下

ax_big.plot(day30, temp, color="#d33f49")
ax_big.set_title("气温(占据左列两行)")
...
plt.show()
图 9-5 真实输出:gs[:, 0] 用切片语法选中「所有行、第 0 列」,height_ratios / width_ratios 控制各行列的相对大小:
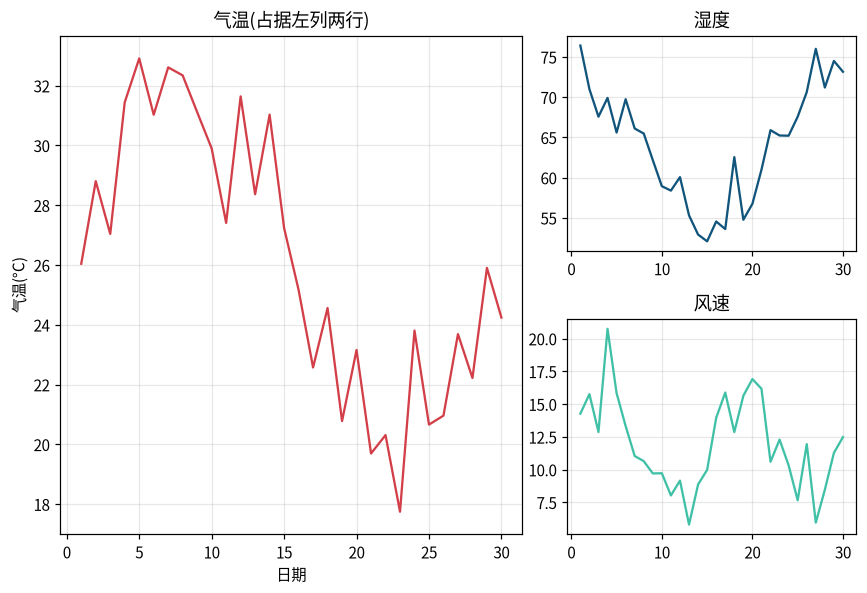
add_gridspec 返回一个可切片的网格对象,fig.add_subplot(gs[行, 列]) 在指定格子里放坐标系——这是「一个大图 + 几个小图」报告版式的标准做法。
9.5 读懂报错:在 Axes 上调用 subplots
subplots 是 pyplot / Figure 的函数,不是 Axes 的方法。手误写成 ax.subplots(...):
>>> fig, ax = plt.subplots()
>>> ax.subplots(1, 2)
Traceback (most recent call last):
  ...
AttributeError: 'Axes' object has no attribute 'subplots'解读:subplots 负责「在画布里开坐标系」,这件事只有画布(或 pyplot)能做;Axes 本身已经是坐标系,没有这个方法。要在一个 Axes 里再分区,得用 GridSpec 而不是 ax.subplots。
动手实践
- 用
subplots(4, 1, sharex=True)画四个天气指标,复现图 9-1。 - 用循环
zip(axes.flat, series)画 2×2 子图,复现图 9-2。 - 造一个有
suptitle的 2×2 图,先不加tight_layout保存,再加后保存,对比图 9-3 与图 9-4。 - 用 GridSpec 画「左大右小」的不规则布局,复现图 9-5。
- 故意执行
ax.subplots(1, 2),读报错并解释。
常见错误
| 错误写法 | 现象 | 原因 |
|---|---|---|
ax.subplots(...) | AttributeError: 'Axes' object has no attribute 'subplots' | subplots 不是 Axes 的方法 |
忘记 tight_layout() | 标题/标签重叠 | 加 fig.tight_layout() 或 layout="constrained" |
| 多个子图重复写设置代码 | 代码冗长易错 | 用循环 + axes.flat |
sharex=True 后忘了只标最下面 x 标签 | 每行都有 x 刻度 | sharex 自动隐藏上面的刻度;手动加标签即可 |
| GridSpec 下标越界 | IndexError | 行/列索引要在 nrows × ncols 内 |
章末练习
基础
- 用
subplots(3, 1, sharex=True)画三个子图,共享 x 轴。 - 用循环画一个 2×2 网格,每个子图画一条不同的三角函数。
- 给 2×2 网格加
suptitle并调用tight_layout()。
提高
- 用 GridSpec 画「上大下小」布局:上面一个宽子图,下面两个并排子图。
- 比较
layout="tight"与layout="constrained"画同一张复杂图,说出两者的差别(提示:constrained 支持 colorbar 等额外元素的避让)。
挑战
- 画一个 2×2 网格,四个子图分别用折线、散点、柱状、直方图展示同一批数据的四种视角,用循环批量设置样式,并配一个总标题。
- 用 GridSpec 复刻一张「报告封面式」布局:左侧一个横跨两行的大图,右侧上下两个小图;并尝试用
width_ratios调比例直到满意。
章末自测
每题选择一个最佳答案。本书不附答案:完成后交由老师或 AI 老师批改讲解。
- 让多个子图共享 x 轴的参数是?
- A.
sharex=True - B.
sharey=True - C.
common_x=True - D.
xlink=True
- A.
- 给整张图加总标题用?
- A.
ax.set_title - B.
fig.suptitle - C.
plt.figure_title - D.
ax.suptitle
- A.
- 遍历 2×2 的
axes数组最方便的是?- A.
axes.flat - B.
axes.ravel()后取[0] - C. 手写
axes[0][0]... - D.
axes.T
- A.
- 修复子图元素重叠的方法?
- A.
fig.tight_layout() - B.
plt.show() - C.
ax.set_visible() - D.
fig.resize()
- A.
fig.add_gridspec(2, 2)创建?- A. 两个坐标系
- B. 一个可切片的 2×2 网格
- C. 两个 Figure
- D. 两个坐标轴
gs[:, 0]表示?- A. 所有行、第 0 列
- B. 第 0 行、所有列
- C. 第 1 行第 0 列
- D. 整张画布
layout="constrained"属于哪种配置?- A. 只在创建时传给
subplots/figure - B. 只能后期调用
- C. 必须配合 GridSpec
- D. 会禁用颜色条
- A. 只在创建时传给
subplots(4, 1, sharex=True)返回的axes是?- A. 4 个独立变量
- B. 长度为 4 的数组
- C. 单个 Axes
- D. Figure
ax.subplots(1, 2)会?- A. 正常创建两个子图
- B.
AttributeError: 'Axes' object has no attribute 'subplots' - C. 创建到别的画布
- D. 报 IndexError
height_ratios=[1, 1]的作用是?- A. 两行等高
- B. 两列等宽
- C. 设置字体高度
- D. 设置图形高度