第 8 章 文本、注释与刻度
学习目标
- 用
ax.text在图中任意位置加文字 - 用
ax.annotate加带箭头的注释 - 用 Locator 控制刻度位置、Formatter 控制刻度文本
- 处理日期刻度
- 用数学符号(mathtext)美化标题与标签
8.1 图内文字:ax.text
ax.text(x, y, 文本) 在数据坐标 (x, y) 处放一段文字。以 30 天气温图为例,在最高点旁标注数值:
import matplotlib.pyplot as plt
import numpy as np

rng = np.random.default_rng(8)
day30 = np.arange(1, 31)
temp30 = 26 + 6 * np.sin(day30 / 30 * 2 * np.pi) + rng.normal(0, 1.5, 30)
peak_i = np.argmax(temp30)

fig, ax = plt.subplots()
ax.plot(day30, temp30)
ax.text(peak_i, temp30[peak_i] + 0.6, f"最高 {temp30[peak_i]:.1f}°C",
        ha="center", fontsize=11, color="#d33f49")
ax.text(1, 20.5, "整体在 26°C 上下波动", fontsize=10, color="#4b5563")
ax.set_title("30 天气温:用 text 在图内加说明")
ax.set_xlabel("日期")
ax.set_ylabel("气温(°C)")
plt.show()
图 8-1 真实输出:ha="center" 让文字以给定点为中心水平对齐(还有 ha="left"/"right"、va="top"/"center"/"bottom" 控制垂直对齐):
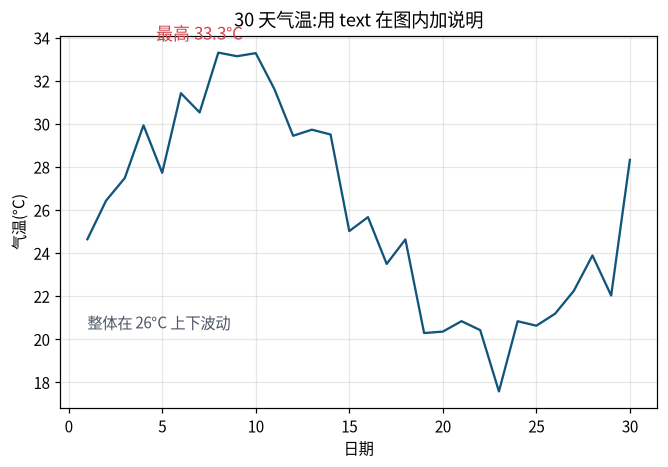
ax.text 的坐标默认是数据坐标(跟着数据走)。想固定在图的角落,用 transform=ax.transAxes,此时 (0,0) 是左下角、(1,1) 是右上角——第 1 章骨架图里的标注就是这么做的。
8.2 带箭头的注释:ax.annotate
ax.annotate(文本, xy=箭头指向的点, xytext=文字所在位置, arrowprops=箭头样式) 是「文字 + 箭头」的组合,专门用来「指出」图里某个关键位置:
fig, ax = plt.subplots()
ax.plot(day30, temp30)
ax.annotate("最热的一天", xy=(peak_i, temp30[peak_i]),
            xytext=(16, 33),
            arrowprops=dict(arrowstyle="->", color="#d33f49", lw=1.5),
            fontsize=11, color="#d33f49")
ax.set_title("30 天气温:用 annotate 加箭头注释")
ax.set_xlabel("日期")
ax.set_ylabel("气温(°C)")
plt.show()
图 8-2 真实输出:箭头从 xytext(文字位置)指向 xy(数据点):
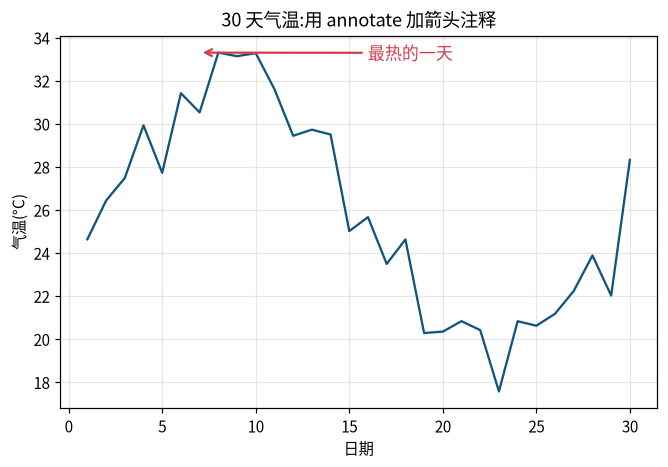
arrowprops 是一个字典,常用键:arrowstyle(箭头形状,"->"、"fancy"、"->," 等)、color、lw(线宽)、connectionstyle(连接曲线样式)。annotate 是「讲故事的图」里最常用的工具。
8.3 刻度定位器与格式化器:Locator / Formatter
自动刻度通常够用,但想精确控制「刻度放哪里、显示成什么样」,要用到两个对象:
- Locator(定位器):决定刻度放在哪些数值上,如
MultipleLocator(2)表示每 2 个单位一个刻度。 - Formatter(格式化器):决定刻度显示成什么文本,如
PercentFormatter、FuncFormatter。
import matplotlib.pyplot as plt
import numpy as np

x = np.linspace(0, 20, 300)
fig, ax = plt.subplots()
ax.plot(x, np.sin(x))
ax.xaxis.set_major_locator(plt.MultipleLocator(2))    # 主刻度:每 2 个单位
ax.xaxis.set_minor_locator(plt.MultipleLocator(0.5))  # 次刻度:每 0.5 个单位
ax.grid(True, which="major", alpha=0.4)
ax.grid(True, which="minor", alpha=0.15)
ax.set_title("MultipleLocator:每 2 个单位一个主刻度")
plt.show()
图 8-3 真实输出:主刻度每 2 单位一格、带较深的网格;次刻度每 0.5 单位、网格更浅:
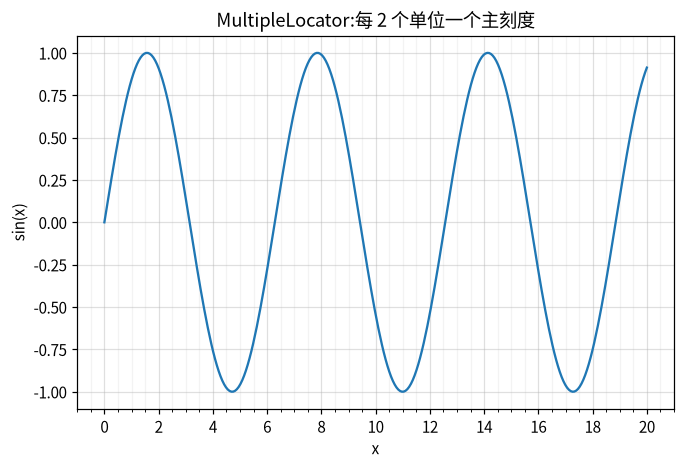
which="major"/"minor" 用来区分主、次刻度分别应用网格或样式。常用定位器还有 MaxNLocator(自动挑「好看」的个数)、FixedLocator(固定位置)、LogLocator(对数刻度)。
8.4 日期刻度
横轴是日期时,Matplotlib 把日期当作「天数」处理,默认刻度可能显示成一串大数字。用 matplotlib.dates 的 DateFormatter 把刻度格式化成 "07-01" 这样的样子:
import datetime
import matplotlib.dates as mdates

dates = [datetime.date(2025, 7, 1) + datetime.timedelta(days=i) for i in range(14)]
sales = rng.integers(80, 150, 14).astype(float)

fig, ax = plt.subplots()
ax.plot(dates, sales, marker="o")
ax.xaxis.set_major_formatter(mdates.DateFormatter("%m-%d"))
ax.set_title("7 月上旬每日销售额")
plt.show()
图 8-4 真实输出:横轴刻度变成 07-01、07-03…… %m 月、%d 日、%Y 年、%H:%M 时分,格式串与 C 语言 strftime 一致:
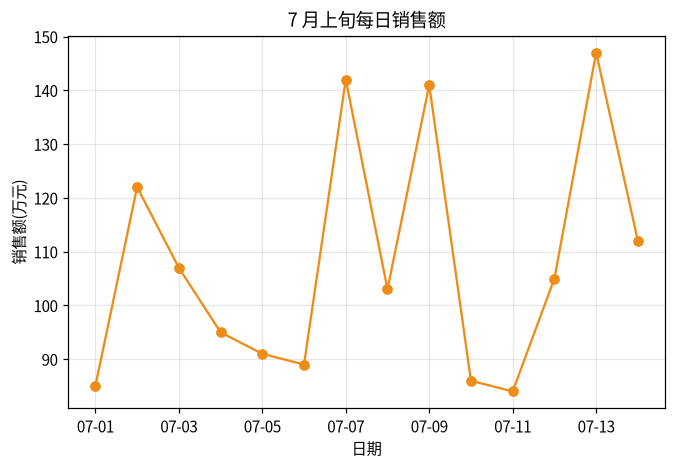
日期坐标与数值坐标一样可以 set_xlim 缩放;大数据量的时间序列,日期刻度几乎必配。
8.5 数学符号:mathtext
标题、标签里想写数学公式,用 mathtext:夹在两个 $ 之间的内容按 LaTeX 语法渲染。字符串前加 r(raw string)避免反斜杠被转义:
ax.set_title(r"阻尼振动 $y = \sin(x)\,e^{-x/10}$", fontsize=13)图 8-5 真实输出:上标、希腊字母、分式都能渲染:
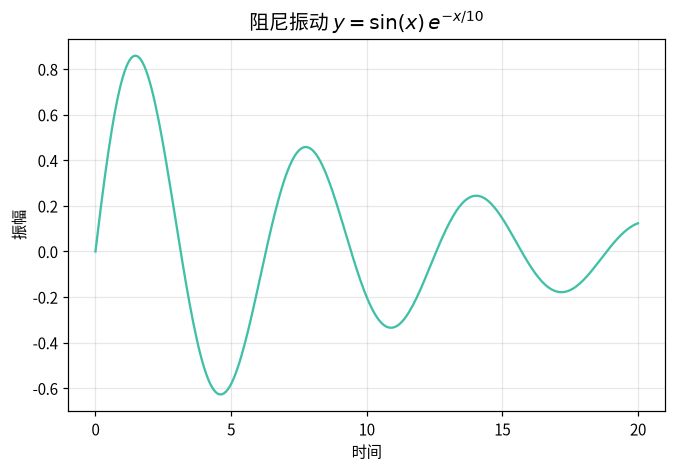
mathtext 不依赖 LaTeX,Matplotlib 内置渲染,适合在轴标签里写单位($\mathrm{kg/m^2}$)、下标($T_1$)、常用公式。
8.6 读懂报错:arrowprops 传了字符串
arrowprops 必须是字典。传字符串会:
>>> ax.annotate("x", xy=(0.5, 0.5), arrowprops="->")
Traceback (most recent call last):
  ...
  File "matplotlib/text.py", line 2064, in __init__
    arrowprops = arrowprops.copy()
AttributeError: 'str' object has no attribute 'copy'
解读:Matplotlib 拿到 arrowprops 后调用 .copy()——字符串没有这个方法,于是报 AttributeError。arrowprops 要写成字典:arrowprops=dict(arrowstyle="->")。
动手实践
- 画一张图,用
ax.text在最高点旁标注数值,复现图 8-1。 - 用
ax.annotate给最低点加箭头注释,复现图 8-2。 - 画
sin(x),用MultipleLocator(2)设置主刻度、0.5设置次刻度,并配主次网格,复现图 8-3。 - 画 14 天的销售额折线图,把横轴刻度格式化成
月-日,复现图 8-4。 - 把图 8-5 的标题改成
$y = x^2 + 1$,运行验证 mathtext 渲染。
常见错误
| 错误写法 | 现象 | 原因 |
|---|---|---|
arrowprops="->" | AttributeError: 'str' object has no attribute 'copy' | arrowprops 必须是字典 |
text 用默认 ha 导致文字跑出图外 | 文字位置不对 | 调 ha/va 或 xytext 偏移 |
忘记字符串前加 r | 数学符号报错或异常 | $ 内反斜杠被转义;用 raw string |
which= 忘写 | 次刻度网格不生效 | 主/次刻度要 which="major"/"minor" 分别设置 |
| 日期没格式化 | 横轴是串大数字 | 用 mdates.DateFormatter |
章末练习
基础
- 用
ax.text在(5, 2)处写一行「峰值」,设置字号与颜色。 - 用
ax.annotate指向sin的波峰,加箭头。 - 用
MultipleLocator(1)设置主刻度。
提高
- 画一条曲线,用
ax.annotate同时注释两个极值点,并使用connectionstyle让箭头弯曲。 - 画 30 天的数据(固定种子),用日期刻度并设置
set_xlim只显示后 15 天。
挑战
- 用
FuncFormatter把 0~100 万的刻度显示成50 万、100 万(提示:定义def fmt(v, pos): return f"{v/10000:.0f} 万",再ax.yaxis.set_major_formatter(FuncFormatter(fmt)))。 - 给一张图配一个「带公式、带箭头注释、带主次刻度」的完整示例,并说明每个元素的
transform/which如何配合。
章末自测
每题选择一个最佳答案。本书不附答案:完成后交由老师或 AI 老师批改讲解。
- 在图内任意位置加文字用?
- A.
ax.title() - B.
ax.text(x, y, s) - C.
ax.label() - D.
ax.write()
- A.
ax.text的坐标默认是?- A. 像素坐标
- B. 数据坐标
- C. 屏幕坐标
- D. 相对坐标
- 带箭头的注释函数是?
- A.
ax.text - B.
ax.annotate - C.
ax.arrow - D.
ax.comment
- A.
arrowprops的正确写法是?- A.
arrowprops="->" - B.
arrowprops=dict(arrowstyle="->") - C.
arrowprops=["->"] - D.
arrowprops=("->")
- A.
MultipleLocator(2)表示?- A. 刻度显示 2 个
- B. 每 2 个单位一个刻度
- C. 坐标轴范围是 2
- D. 刻度字号为 2
- 次刻度用
which=的哪个值?- A.
"major" - B.
"minor" - C.
"all" - D.
"sub"
- A.
- 日期刻度格式化成
07-01用?- A.
mdates.DateFormatter("%m-%d") - B.
mdates.DateFormatter("%Y") - C.
ax.set_datefmt() - D.
ax.set_xticklabels()手工写
- A.
- mathtext 写数学公式,公式部分用?
- A. 圆括号
- B. 两个
$夹住 - C. 方括号
- D. 反引号
- 写含
\的字符串应加前缀?- A.
f - B.
r - C.
b - D.
u
- A.
ax.annotate中xytext指?- A. 箭头指向的点
- B. 文字所在的位置
- C. 坐标轴范围
- D. 刻度位置